Pairing samples with R
1、paired design
配对设计举例
回归性研究设计分为两类,一类是非配对的成组设计(完全随机设计),另一类是成组设计。配对设计是成组设计的特例,通常配对设计的检验效能高于成组设计。下面是配对设计举例:
- 某研究者对8名冻疮患者足部的两个冻疮部位,用2种不同的药物治疗,分别观察冻疮的治愈时间。
对于8名患者当中的任意一名患者,可以认为两个冻疮部位的严重程度非常接近,处用药因素外,其它因素完全相同。
- 为了研究心肌梗死新药对小猪体内肿瘤坏死因子的影响,将小猪按照性别、体重等配成10对。每个对子中的2只小猪随机分配到常规药物和新药物组中。
配对设计:随机区组设计的一种特例。随机区组设计:按照区组因素,把受试对象划分成不同的区组,同一区组的个体因素被认为完全相同。配对:在例子1中,它的区组就是一个人,一个人为一个区组。
配对设计的分类
- 自身配对(例子1)
- 前后配对,同一药物治疗前后,这种设计应该与含有时间因素的方差分析比较。
- 异体配对(例子2)
2、how to pair a bulk of samples with R?
2.1 Datasets and R packages
"Right heart catheterization dataset" was used in this example. Right heart catheterization dataset The dataset pertains to day 1 of hospitalization, i.e., the "treatment" variable swang1 is whether or not a patient received a RHC (also called the Swan-Ganz catheter) on the first day in which the patient qualified for the SUPPORT study.
two r packges were used.
library(tableone)
library(Matching)
Load datasets and extract targeted varibles.
load(url("https://biostat.app.vumc.org/wiki/pub/Main/DataSets/rhc.sav"))

ARF = as.numeric(rhc$cat1=='ARF')
CHF = as.numeric(rhc$cat1 == 'CHF')
Cirr = as.numeric(rhc$cat1 == 'Cirrhosis')
colcan = as.numeric(rhc$cat1 == 'Colon Cancer')
Coma = as.numeric(rhc$cat1 == 'Coma')
COPD = as.numeric(rhc$cat1 == 'COPD')
lungcan = as.numeric(rhc$cat1 == 'Lung Cancer')
MOSF = as.numeric(rhc$cat1 == 'MOSF w/Malignancy')
sepsis = as.numeric(rhc$cat1 == 'MOSF w/Sepsis')
female = as.numeric(rhc$sex == 'Female')
died = as.numeric(rhc$death == 'Yes')
age = rhc$age
treatment = as.numeric(rhc$swang1 == 'RHC')
meanbp1 = rhc$meanbp1
Extract some varibles as a new dataframe.
mydata = cbind(ARF,CHF,Cirr,colcan,Coma,lungcan,MOSF,sepsis,age,female,meanbp1,treatment,died)
mydata = as.data.frame(mydata)
xvars = c('ARF','CHF','Cirr','colcan','Coma','lungcan','MOSF','sepsis','age','female','meanbp1')
Create table one
table1 = CreateTableOne(vars = xvars,strata = 'treatment',data = mydata,test = F)
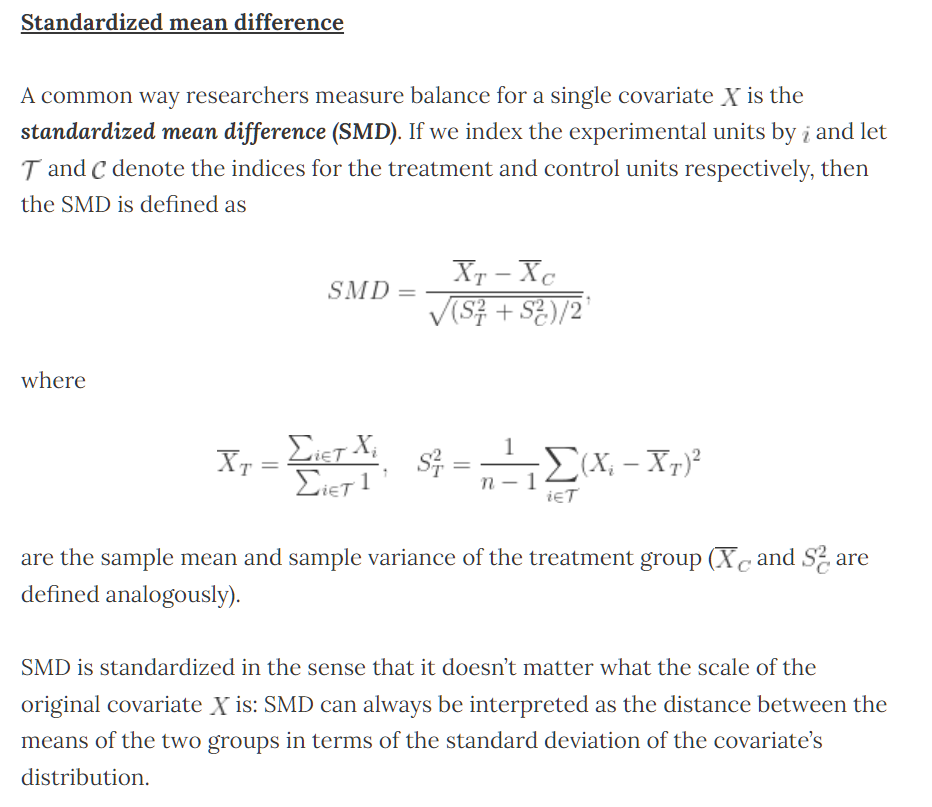
print(table1,smd = T)
2.2 how to assess balance between treated and control groups
one could assess balance with hypothesis tests
difference in means between treated and contols for each covariate.
- Two sample t-tests
- Report p-value for each test
p-values are dependent on sample size,small differences in means will have a small p-value if sample size is large.
