分类 默认分类 下的文章

1、paired design

配对设计举例

回归性研究设计分为两类,一类是非配对的成组设计(完全随机设计),另一类是成组设计。配对设计是成组设计的特例,通常配对设计的检验效能高于成组设计。下面是配对设计举例:

  1. 某研究者对8名冻疮患者足部的两个冻疮部位用2种不同的药物治疗,分别观察冻疮的治愈时间。

对于8名患者当中的任意一名患者,可以认为两个冻疮部位的严重程度非常接近,处用药因素外,其它因素完全相同。

  1. 为了研究心肌梗死新药对小猪体内肿瘤坏死因子的影响,将小猪按照性别、体重等配成10对。每个对子中的2只小猪随机分配到常规药物和新药物组中。

配对设计:随机区组设计的一种特例。
随机区组设计:按照区组因素,把受试对象划分成不同的区组,同一区组的个体因素被认为完全相同。
配对:在例子1中,它的区组就是一个人,一个人为一个区组。

配对设计的分类

  1. 自身配对(例子1)
  2. 前后配对,同一药物治疗前后,这种设计应该与含有时间因素的方差分析比较
  3. 异体配对(例子2)

2、how to pair a bulk of samples with R?

2.1 Datasets and R packages

"Right heart catheterization dataset" was used in this example. Right heart catheterization dataset The dataset pertains to day 1 of hospitalization, i.e., the "treatment" variable swang1 is whether or not a patient received a RHC (also called the Swan-Ganz catheter) on the first day in which the patient qualified for the SUPPORT study.
two r packges were used.

library(tableone)
library(Matching)

Load datasets and extract targeted varibles.

load(url("https://biostat.app.vumc.org/wiki/pub/Main/DataSets/rhc.sav"))

ARF = as.numeric(rhc$cat1=='ARF')
CHF = as.numeric(rhc$cat1 == 'CHF')
Cirr = as.numeric(rhc$cat1 == 'Cirrhosis')
colcan = as.numeric(rhc$cat1 == 'Colon Cancer')
Coma = as.numeric(rhc$cat1 == 'Coma')
COPD = as.numeric(rhc$cat1 == 'COPD')
lungcan = as.numeric(rhc$cat1 == 'Lung Cancer')
MOSF = as.numeric(rhc$cat1 == 'MOSF w/Malignancy')
sepsis = as.numeric(rhc$cat1 == 'MOSF w/Sepsis')
female = as.numeric(rhc$sex == 'Female')
died = as.numeric(rhc$death == 'Yes')
age = rhc$age
treatment = as.numeric(rhc$swang1 == 'RHC')
meanbp1 = rhc$meanbp1

Extract some varibles as a new dataframe.

mydata = cbind(ARF,CHF,Cirr,colcan,Coma,lungcan,MOSF,sepsis,age,female,meanbp1,treatment,died)
mydata = as.data.frame(mydata)
xvars = c('ARF','CHF','Cirr','colcan','Coma','lungcan','MOSF','sepsis','age','female','meanbp1')

Create table one

table1 = CreateTableOne(vars = xvars,strata = 'treatment',data = mydata,test = F)
print(table1,smd = T)

2.2 how to assess balance between treated and control groups

one could assess balance with hypothesis tests

difference in means between treated and contols for each covariate.

  • Two sample t-tests
  • Report p-value for each test

p-values are dependent on sample size,small differences in means will have a small p-value if sample size is large.

2023-05-20T15:51:35.png

In this episode, let’s go over how to set up a simple but secure tunnel (read: VPN) to your local LAN (read: homelab) using WireGuard. We’ll be going with the VPS route so we don’t have to expose any ports to the internet.

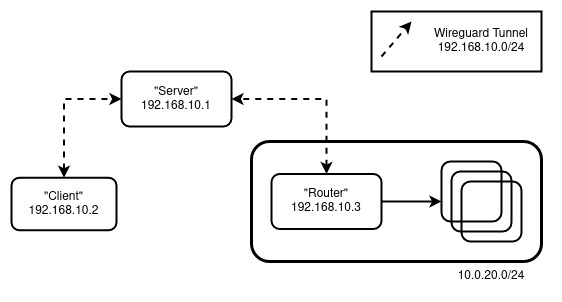
We’ll be emulating the following setup:
2023-04-10T15:45:01.png

The Cast:

  • “Router” - The machine that will serve as the gateway (inwards) to your LAN
  • “Server” - The machine with a publicly accessible IP that all clients will connect to. Also known as a “Bounce Server”
  • “Client” - You, trying to connect to your LAN remotely somewhere

set up

Note: All the machines here are Ubuntu-based. Adjust the setup accordingly to your distro of choice.

For “Server” and “Router” perform the following:

sudo apt update && sudo apt upgrade
sudo apt install wireguard
wg genkey | tee privatekey | wg pubkey > publickey
sudo sysctl net.ipv4.ip_forward=1

Note: To persist IP Forwarding, edit /etc/sysctl.conf with net.ipv4.ip_forward=1

Execute the following command to make the changes take effect: sysctl -p /etc/sysctl.conf

For the “Server”, create /etc/wireguard/wg0.conf with:

[Interface]
Address = 192.168.10.1/32
ListenPort = 51820
PrivateKey = <Server's Private Key>

# Router Peer
[Peer]
PublicKey = <Router's Public Key>
AllowedIPs = 192.168.10.0/24, 10.0.20.0/24

For the “Router”, create /etc/wireguard/wg0.conf with:

[Interface]
Address = 192.168.10.3/32
PrivateKey = <Router's Private Key>
PostUp = iptables -A FORWARD -i wg0 -j ACCEPT; iptables -t nat -A POSTROUTING -o ens18 -j MASQUERADE
PostDown = iptables -D FORWARD -i wg0 -j ACCEPT; iptables -t nat -D POSTROUTING -o ens18 -j MASQUERADE

# if your target network cart("above ens18") si behind the virtual bridge like vmbr0 on pve,replace configurations with below. -s for the wireguard intranet segment.
PostUp = iptables -A FORWARD -i wg0 -j ACCEPT; iptables -A FORWARD -i vmbr0 -j ACCEPT; iptables -t nat -A POSTROUTING -s '192.168.10.0/24' -o vmbr0 -j MASQUERADE
PostDown = iptables -D FORWARD -i wg0 -j ACCEPT; iptables -D FORWARD -i vmbr0 -j ACCEPT; iptables -t nat -D POSTROUTING -s '192.168.10.0/24' -o vmbr0 -j MASQUERADE


# Server
[Peer]
PublicKey = <Server's Public Key>
Endpoint = <Server's Public IP>:51820
AllowedIPs = 192.168.10.0/24
PersistentKeepalive = 25

Note: Replace ens18 with the appropriate interface

Enable the interface by wg-quick up wg0 and then check the status by wg show.

At this point, we can perform a quick sanity check. On my setup, running mtr 10.0.20.1 on the “Server” yields:

                         Packets               Pings
Host                   Loss%   Snt   Last   Avg  Best  Wrst StDev
1. 192.168.10.3        0.0%     2   61.8  41.5  21.1  61.8  28.8
2. 10.0.20.1           0.0%     2   48.3  33.0  17.6  48.3  21.7

“Client”

On the “Client” perform the following:

sudo apt update && sudo apt upgrade
sudo apt install wireguard
wg genkey | tee privatekey | wg pubkey > publickey

Then create /etc/wireguard/wg0.conf with:

[Interface]
Address = 192.168.10.2/32
PrivateKey = <Client's Private Key>

[Peer]
PublicKey = <Server's Public Key>
Endpoint = <Server's Public IP>:51820
AllowedIPs = 10.0.20.0/24
PersistentKeepalive = 25

Enable the interface by wg-quick up wg0 and then check the status by wg show. We also need to update the wg0.conf of “Server” with “Client” as a new peer.

Update “Server” with:

[Interface]
Address = 192.168.10.1/32
ListenPort = 51820
PrivateKey = <Server's Private Key>

# Router LAN
[Peer]
PublicKey = <Router's Public Key>
AllowedIPs = 192.168.10.0/24, 10.0.20.0/24

# Client
[Peer]
PublicKey = <Client's Public Key>
AllowedIPs = 192.168.10.2/32

Note: Don’t forget to restart the wg0 interface by wg-quick down wg0 && wg-quick up wg0.

Now, running mtr 10.0.20.1 on the “Client” yields:

                         Packets               Pings
Host                   Loss%   Snt   Last   Avg  Best  Wrst StDev
1. 192.168.10.1        0.0%     6   41.2  42.1  21.4  73.6  18.7
2. 192.168.10.3        0.0%     5   64.8  72.0  41.8  88.1  19.3
3. 10.0.20.1           0.0%     5   77.4  62.3  43.0  77.4  13.3

Which follows the “Client” -> “Server” -> “Router” flow that we want.

Note:Use wireguard with systemd:

systemctl enable wg-quick@wg0
systemctl daemon-reload
systemctl start systemd-networkd
systemctl start wg-quick@wg0

Installation

I recommend using Miniconda to manage packages and creating an entirely new environment to install scanpy.

conda install -c conda-forge scanpy python-igraph leidenalg

Basic conception before your start

AnnData class

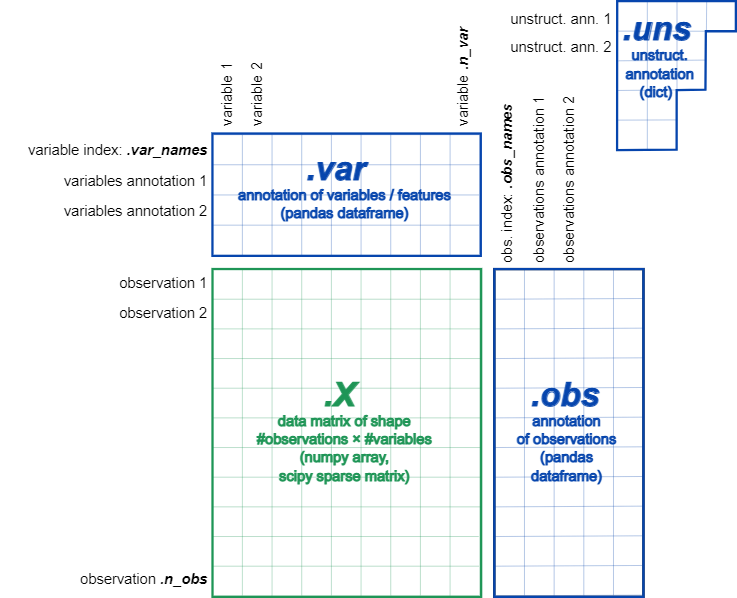
An "AnnData" class is the interface to the Scanpy operation, meaning we must create an AnnData object as a parameter to the Scanpy function.
2023-03-28T15:06:16.png
At the most basic level, an AnnData object adata stores a data matrix adata.X, annotation of observations adata.obs and variables adata.var as pd.DataFrame and unstructured annotation adata.uns as dict. Names of observations and variables can be accessed via adata.obs_names and adata.var_names, respectively. AnnData objects can be sliced like dataframes, for example, adata_subset = adata[:, list_of_gene_names]

import scanpy as sc
import os
adata = sc.read_csv('../data/GSM5226574_C51ctr_raw_counts.csv').T
adata

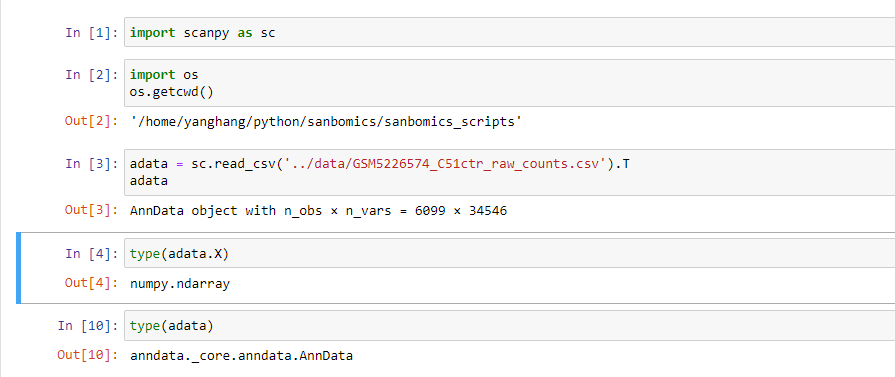
Let's see the properties of AnnData.

type(adata) 
type(adata.X)
adata.var #extract var(python DataFrame object that describe genes)
adata.obs #extract observations(python DataFrame object that describe cells)

adata.var_names #return an index objects of gene names
adata.obs_names #return an index objects of cell barcodes

2023-03-28T15:28:07.png

安装包

首先安装所需要的包

library(Seurat)
library(stringr)
library(R.utils)
library(tidyverse)
library(ggsci)

获得绘图数据

Seurat包中的FeatchData函数可以从Seurat对象metadata中取相应的列并且返回一个数据框。

plot_data = FetchData(object = sce, 
                      #注意此处要加入unique函数,有时候一个marker基因对应多个细胞
                      vars = c(unique(marker_selected_1$gene), "celltype"), #选择所需要的列
                      slot = 'data') %>% 
  dplyr::rename(group = as.name("celltype")) %>% 
  tidyr::pivot_longer(cols = -group, names_to = 'Feat', values_to = 'Expr')

我们将绘图封装成一个函数

ViolinPlot <- function(object, groupBy, MarkerSelected) {
  # (1)获取绘图数据1
  plot_data = FetchData(object = object, 
                        vars = c(MarkerSelected$gene, groupBy), 
                        slot = 'data') %>% 
    dplyr::rename(group = as.name(groupBy)) %>% 
    tidyr::pivot_longer(cols = -group, names_to = 'Feat', values_to = 'Expr')
  
  # (2)获取绘图数据2
  ident_plot = MarkerSelected %>% 
    dplyr::select(cluster, gene)
  
  # (3)绘图
  figure_1 = ggplot(data = plot_data, mapping = aes(x = Expr,
                                                    y = fct_rev(factor(x = Feat, 
                                                                       levels = MarkerSelected$gene)), 
                                                    fill = group, 
                                                    label = group)) +
    geom_violin(scale = 'width', adjust = 1, trim = TRUE) +
    scale_x_continuous(expand = c(0, 0), labels = function(x)
      c(rep(x = '', times = length(x) - 2), x[length(x) - 1], '')) +
    facet_grid(cols = vars(group), scales = 'free') +
    cowplot::theme_cowplot(font_family = 'Arial') +
    scale_fill_manual(values = paletteer::paletteer_d('ggsci::category20c_d3')) +
    xlab('Expression Level') + 
    ylab('') +
    theme(legend.position = 'none', 
          panel.spacing = unit(x = 0, units = 'lines'),
          axis.line = element_blank(), #去除x和y轴坐标线(不包括axis tick);
          panel.background = element_rect(fill = NA, color = 'black'),
          strip.background = element_blank(), #去除分页题头背景;
          strip.text = element_text(color = 'black', size = 10, family = 'Arial', face = 'bold'),
          axis.text.x = element_text(color = 'black', family = 'Arial', size = 11),
          axis.text.y = element_blank(),
          axis.title.x = element_text(color = 'black', family = 'Arial', size = 15),
          axis.ticks.x = element_line(color = 'black', lineend = 'round'),
          axis.ticks.y = element_blank(),
          axis.ticks.length = unit(x = 0.1, units = 'cm'))
  
  figure_2 = ggplot(data = ident_plot, aes(x = 1,
                                           y = fct_rev(factor(x = gene, levels = MarkerSelected$gene)),
                                           fill = cluster)) +
    geom_tile() +
    theme_bw(base_size = 12) +
    scale_fill_manual(values = paletteer::paletteer_d('ggsci::category20c_d3')) + #注意这里的颜色个数,超过无法运行
    scale_x_continuous(expand = c(0, 0)) +
    scale_y_discrete(expand = c(0, 0)) +
    guides(fill = guide_legend(direction = 'vertical',
                               label.position = 'right',
                               title.theme = element_blank(),
                               keyheight = 0.5,
                               nrow = 2)) +
    xlab('Feature') +
    theme(legend.text = element_text(family = 'Arial', color = 'black', size = 11),
          legend.position = 'bottom',
          legend.justification = 'left',
          legend.margin = margin(0,0,0,0),
          legend.box.margin = margin(-10,05,0,0),
          panel.spacing = unit(0, 'lines'),
          panel.background = element_blank(),
          panel.border = element_blank(),
          plot.background = element_blank(),
          plot.margin = unit(x = c(0,0,0,0), units = 'cm'),
          axis.title.y = element_blank(),
          axis.text.y = element_text(angle = 0, hjust = 1, vjust = 0.5, color = 'black', family = 'Arial'),
          axis.title.x = element_blank(),
          axis.ticks.x = element_blank(),
          axis.text.x = element_blank())
  
  figure_2 + figure_1 + patchwork::plot_layout(nrow = 1, widths = c(0.03, 0.97))
}